
Marketing Agency Industry Statistics: 2026 Benchmarks
Most agency owners encounter two facts that seem contradictory: there are over 71,000 digital agencies in North America alone — and yet 93% of marketing service firms say their growth engine isn't strong enough. This collection brings together the most-cited marketing agency industry statistics for 2026, organized around the benchmarks that actually matter for running and growing an agency: profit margins, revenue per employee, new business pipeline, and the performance gap between specialized and generalist firms.
Key Marketing Agency Statistics
The essential benchmarks in one place, sourced from primary surveys and analyst reports.
93% of marketing services and professional services firms say their growth engine isn't strong enough. (Source: RSW/US 2025 Agency Survey, September 2025)
The average digital agency earned a 13% after-tax net margin in 2025, down from the long-run average of ~15% since 2015. (Source: Promethean Research, 2026 State of Digital Services, N=119 agency leaders)
87% of North American digital agencies employ fewer than 50 people. (Source: Promethean Research, Digital Agency Industry Report, 2026)
75% of agencies cite referrals as their primary source of new business — a dependency RSW/US describes as unsustainable without disciplined outbound to back it up. (Source: RSW/US 2025 Agency Survey)
Agencies that narrowed their service offerings averaged 30% net margins in 2025, more than double the 13% industry average. (Source: Promethean Research, 2026 State of Digital Services)
Marketing agencies averaged $163,000 in revenue per full-time employee in 2025. (Source: Promethean Research, 2026 State of Digital Services)
Only 14% of agencies describe their sales pipeline as "very healthy." (Source: SparkToro State of Digital Agencies Survey, 2025)
Average agency revenue growth was 7.5% in 2025, a partial rebound from a 5% low in 2024. (Source: Promethean Research, Digital Agency Industry Report, 2026)
Takeaway: The pattern across all eight numbers is the same: the agency industry is crowded, margins are compressing, and most firms are structurally underinvested in the thing that would fix it. If any of these numbers describe your agency, the problem isn't unique to you, but the solution has to be.
Industry Scale: How Many Marketing Agencies Are There?
The agency industry is larger than most people realize — and growing faster than agency owners' pipelines suggest.
“There are more than 71,000 digital agencies in North America as of 2026, up from approximately 50,000 in 2024 — a 12% compound annual growth rate since 2018.”
The global agency count exceeds 200,000 across all markets. (Source: Promethean Research, Digital Agency Industry Report, 2026)
87% of North American digital agencies employ fewer than 50 people. The industry is overwhelmingly composed of small and micro firms competing in the same local and vertical markets. (Source: Promethean Research, Digital Agency Industry Report, 2026)
The average agency in Promethean Research's 2026 survey sample had 31 employees and $4.43M in revenue. (Source: Promethean Research, 2026 State of Digital Services, N=119)
Average agency revenue growth has ranged from 5% to 12% annually since 2022, with 2024 being the weakest year (5%) and 2025 showing a partial recovery to 7.5%. (Source: Promethean Research, Digital Agency Industry Report, 2026)
Large agencies grew 2.7× faster than small agencies in 2025, widening the performance gap that has been building since 2022. (Source: Promethean Research, 2026 State of Digital Services)
Takeaway: The takeaway isn't that the market is too crowded to compete in. It's that the market is too crowded to compete in as a generalist. 71,000 agencies that all look the same are effectively invisible to buyers who don't know how to tell them apart. The agencies growing faster than the 7.5% average aren't doing more, they're doing less, for a more specific client.
Average Digital Agency Revenue Growth Rate by Year
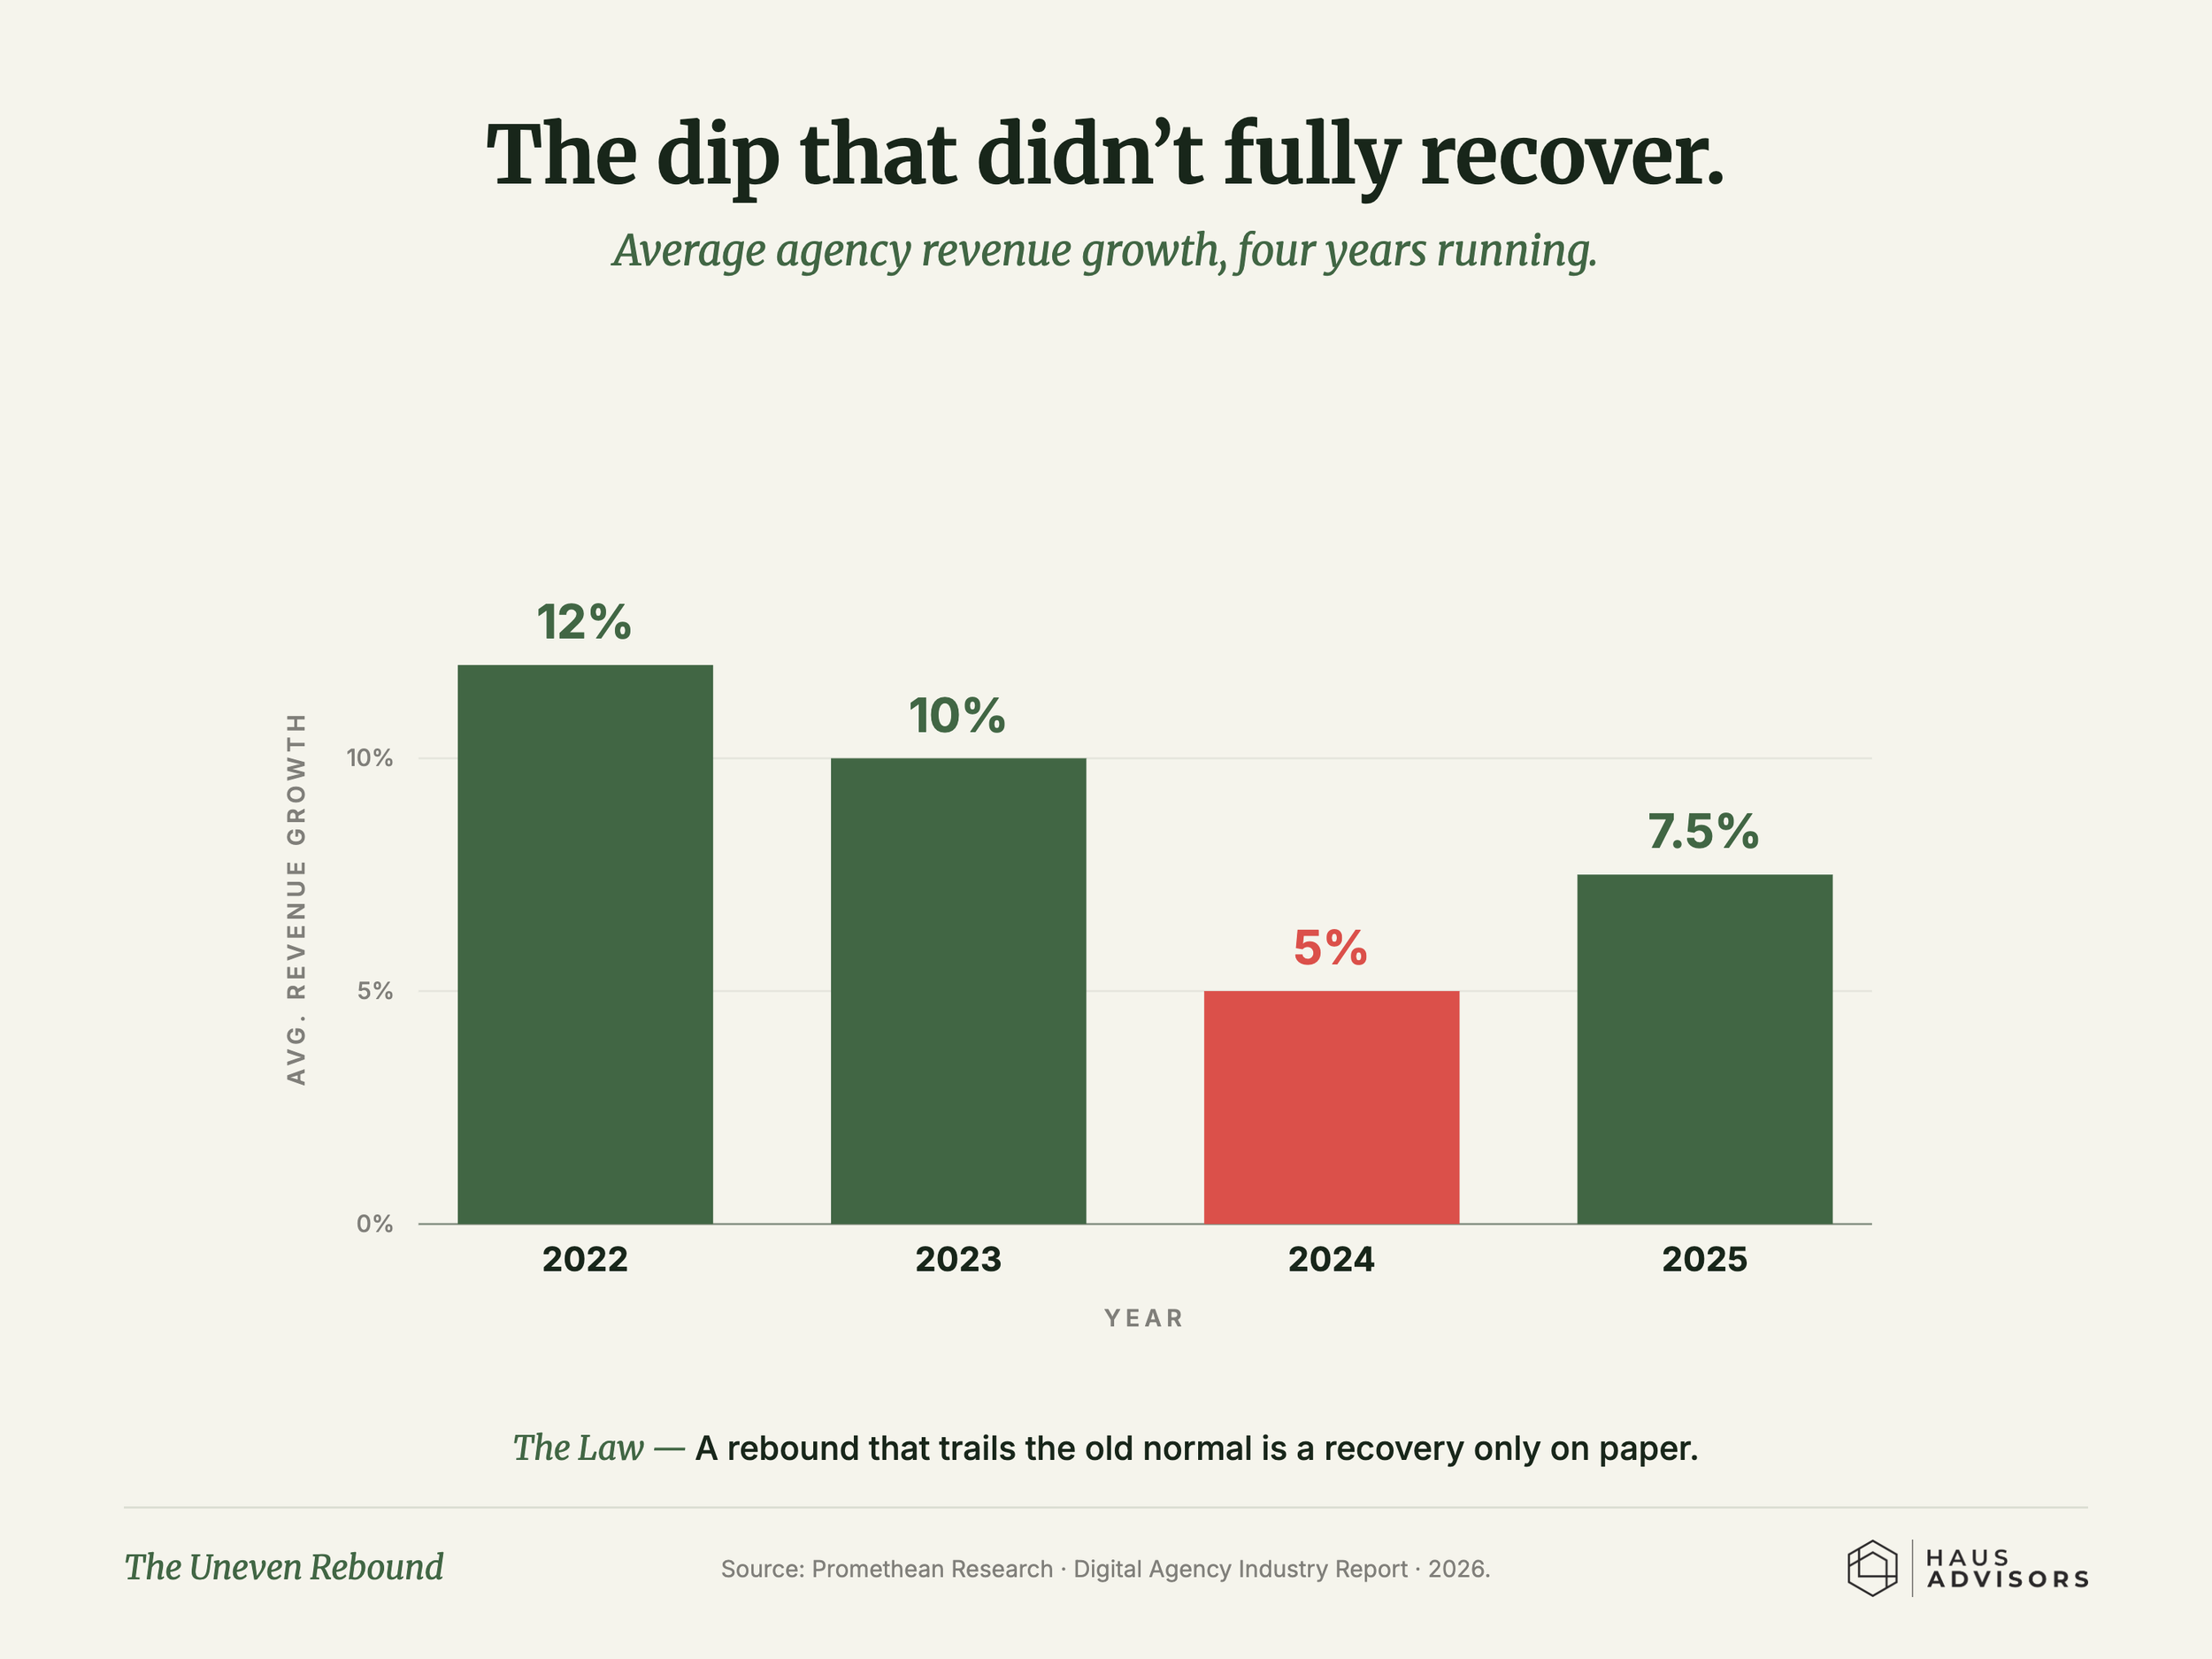
Promethean Research, Digital Agency Industry Report, 2026
Agency Profit Margins: Benchmarks by Size and Type
Full 2026 margin benchmarks by agency size and service type, plus what to check first if yours are below average, live in our agency profit margin benchmarks guide. The highlights are below.
Agency profitability is real, but highly uneven. The most consistent finding across multiple years of research is that smaller agencies earn higher margins than larger ones, and more focused agencies earn higher margins than blended generalists.
“Studio agencies with fewer than 10 employees averaged 19% after-tax net margins in 2025. Agencies with 50 or more employees averaged 8% — less than half.”
Agency Net Margin by Firm Size (2025)
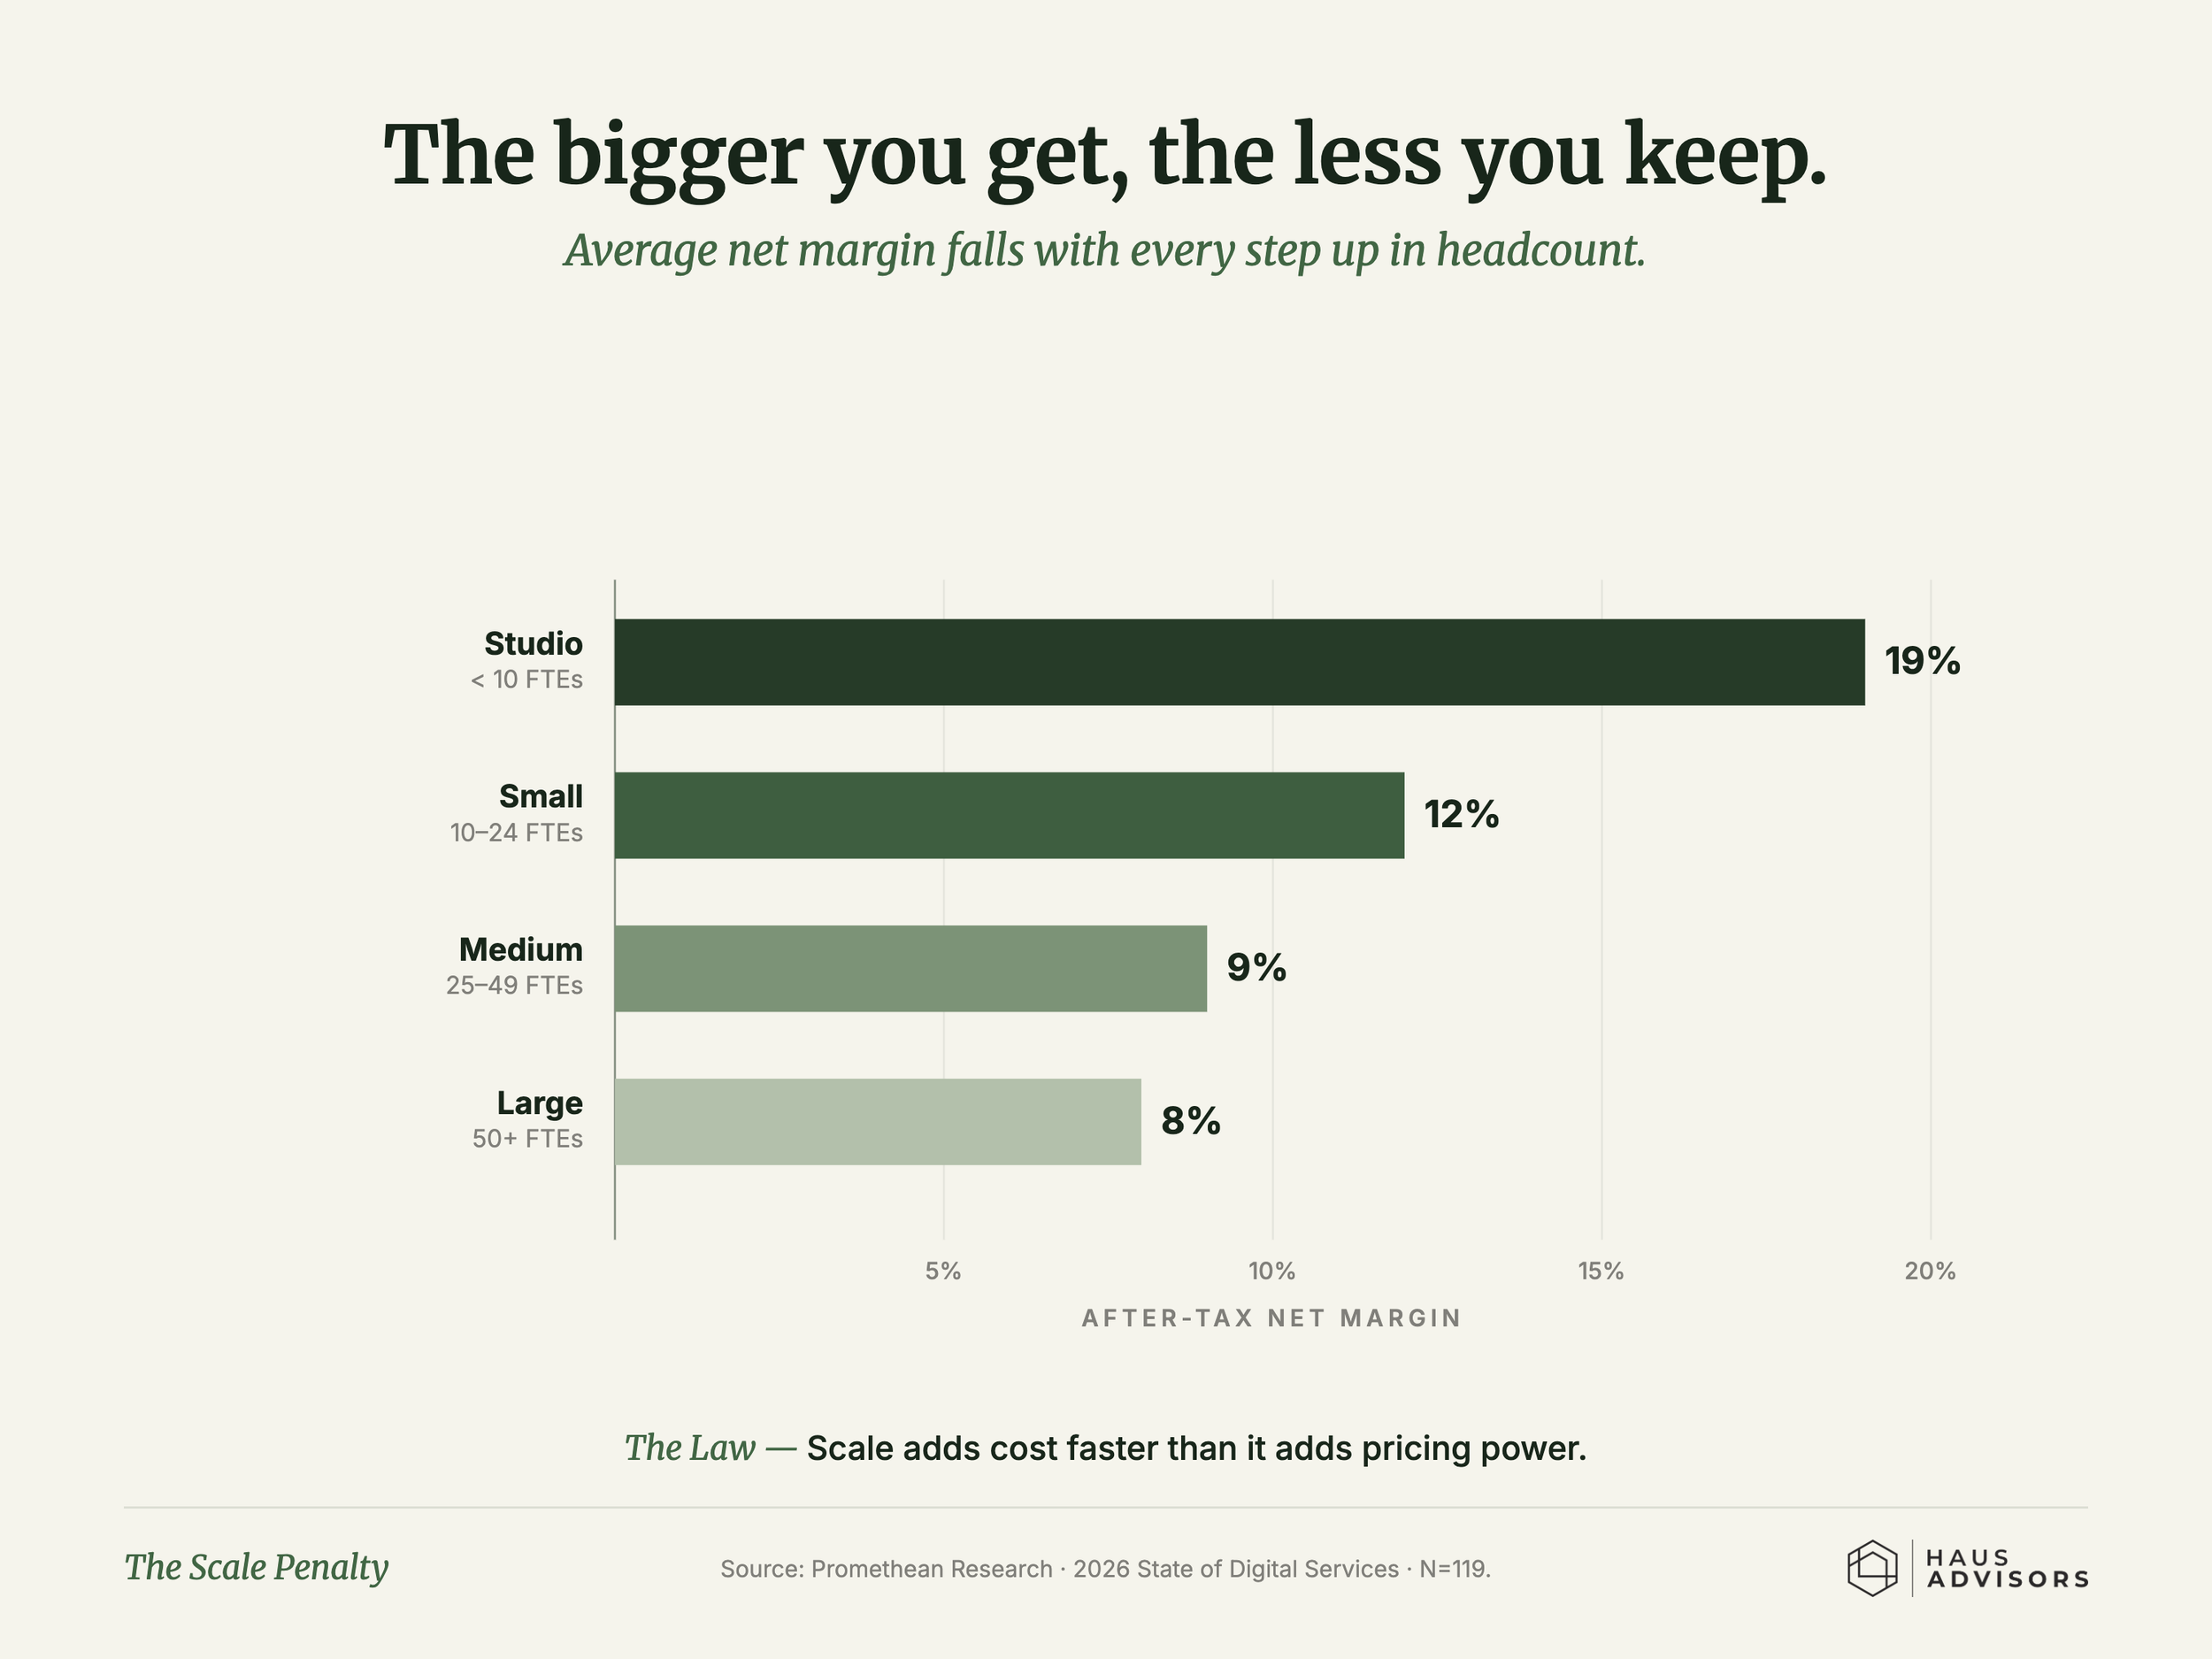
Promethean Research, 2026 State of Digital Services · N=119 agency leaders surveyed February 2026
The average digital agency after-tax net margin was 13% in 2025, below the long-run average of ~15% since 2015. (Source: Promethean Research, 2026 State of Digital Services)
Design agencies posted the highest average net margin by type at 18%, followed by marketing and blended agencies at 13%, and development agencies at 11%. (Source: Promethean Research, 2026 State of Digital Services)
Agencies only allocate 7% of revenue to sales and marketing combined, with revenue-generation employees making up just 6.6% of total agency headcount. (Source: Promethean Research, Digital Agency Industry Report, 2026)
Takeaway: If your margin is below 13%, you're not underperforming, you're average. The question is whether average is acceptable. The 19% studios and 30% specialists didn't get there by working harder. They got there by making deliberate choices about what they would and wouldn't take on. Margin is mostly a positioning decision that shows up in the numbers later.
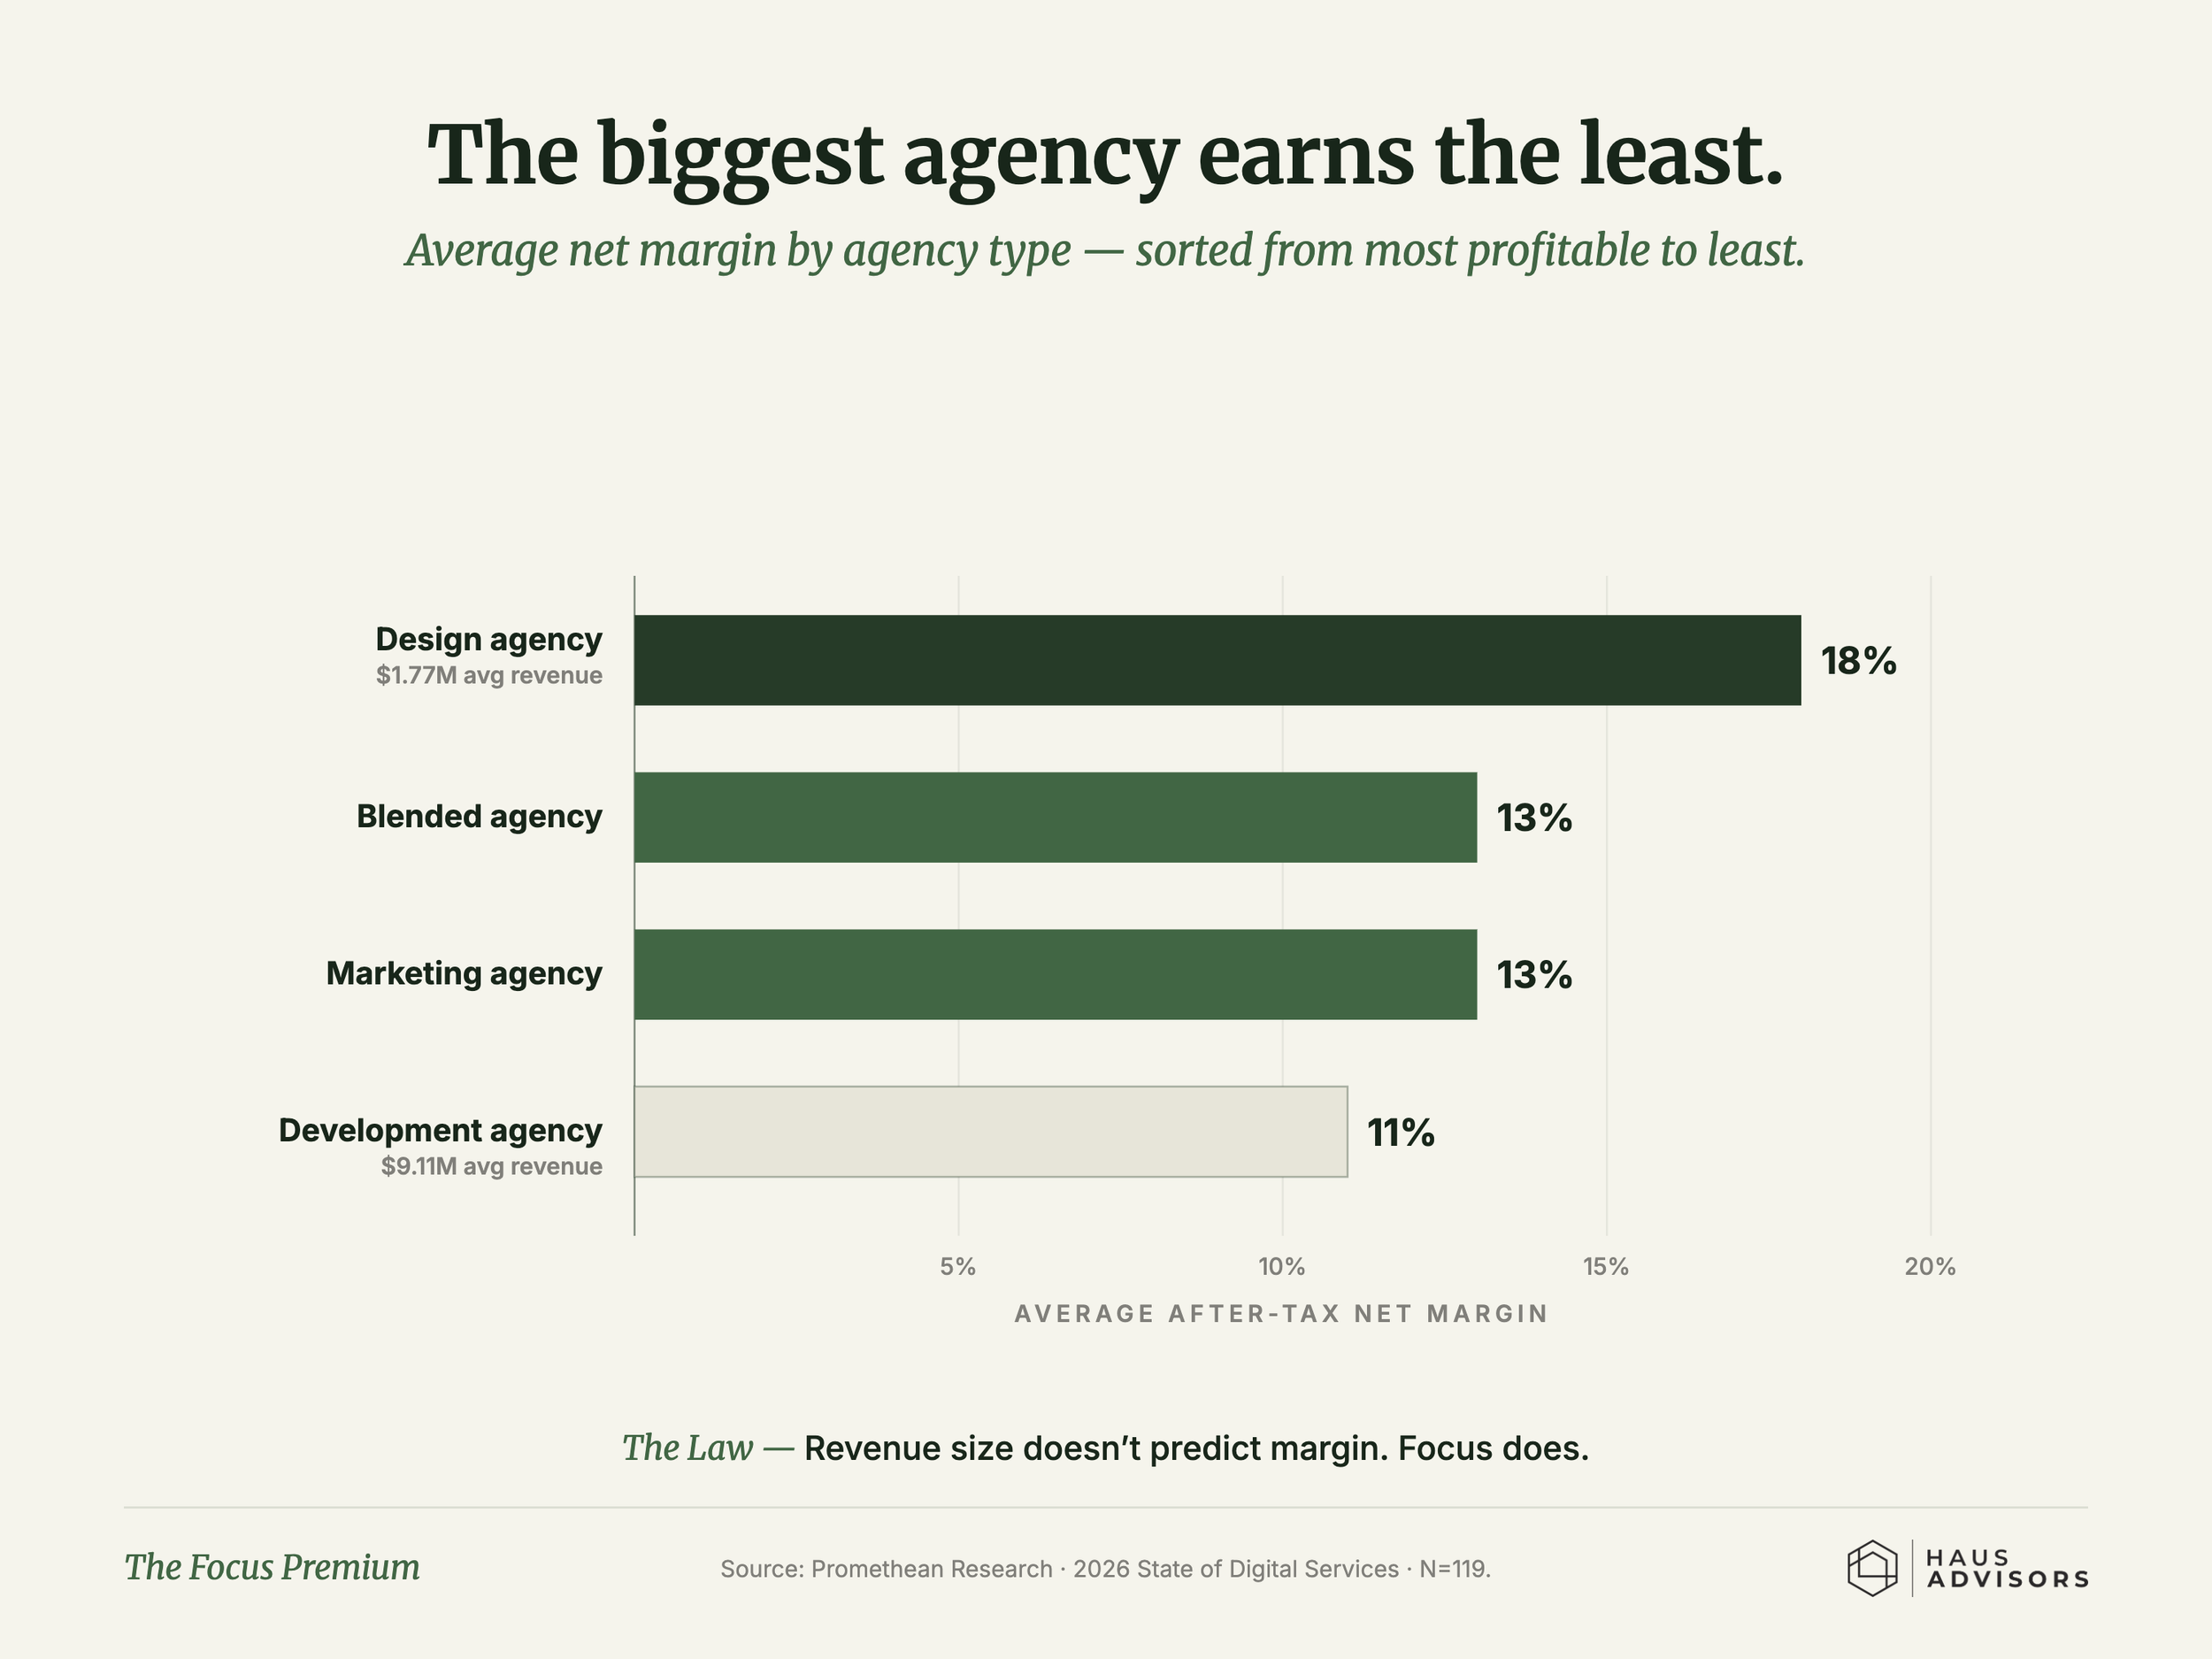
Source: Promethean Research, 2026 State of Digital Services. N=119 agency leaders surveyed February 2026. Implied profit figures combine average revenue and average margin by archetype.
Revenue Per Employee: The Efficiency Benchmark
Revenue per full-time employee (RPE) is the ratio that tells you whether your agency is building leverage or just adding cost. It captures whether headcount growth is translating into productivity, or just overhead.
“Marketing agencies averaged $163,000 in revenue per full-time employee in 2025. Below $120,000 signals a structural problem; specialist agencies should target $250,000 or higher.”
Marketing agencies averaged $163,000 revenue per FTE in 2025. Blended agencies averaged $167,000; development agencies averaged $120,000. (Source: Promethean Research, 2026 State of Digital Services)
U.S. agencies collectively averaged approximately $220,000 per employee in 2025, a figure skewed upward by large holding company agencies with significant scale advantages. (Source: AdAge Agency Report, as analyzed by Iota Finance, 2025)
Generalist agencies should target $180,000+ in revenue per employee; specialist agencies should target $250,000+, according to agency consultant Karl Sakas of Sakas & Company. Agencies below $120,000 face significant structural risk. (Source: Sakas & Company, "Per-Capita Billables: Track Your Agency's Performance")
The Agency Management Institute's profitability benchmarks imply a healthy RPE range of $135,000–$257,000, derived from its 55:25:20 ratio applied to typical agency compensation structures. (Source: Agency Management Institute)
Production employees make up approximately two-thirds of the typical agency workforce, rising to roughly three-quarters when project management roles are included. (Source: Promethean Research, Digital Agency Industry Report, 2026, based on 3,172 positions at 1,228 digital agencies)
Revenue-generating employees (sales and marketing) account for only 6.6% of total agency headcount, excluding account managers. (Source: Promethean Research, Digital Agency Industry Report, 2026)
Takeaway: Your RPE number tells you whether you have a pricing problem, a headcount problem, or both. Below $120K almost always means you've grown headcount ahead of revenue, either through optimistic hiring or scope creep that wasn't billed. Between $120K and $163K usually means pricing hasn't kept pace with the value you're delivering. Above $180K means you're building leverage, not just capacity.
New Business and Pipeline: The Numbers Behind the Problem
New business is the number-one pain point for agency owners year after year. The data explains why: most agencies are structurally underinvested in pipeline generation, deeply dependent on referrals, and pitching at a cost that takes years to recover.
“93% of marketing services and professional services firms say their growth engine is not strong enough — and yet 79% have no one dedicated to their own marketing, and 70% have no full-time salesperson.”
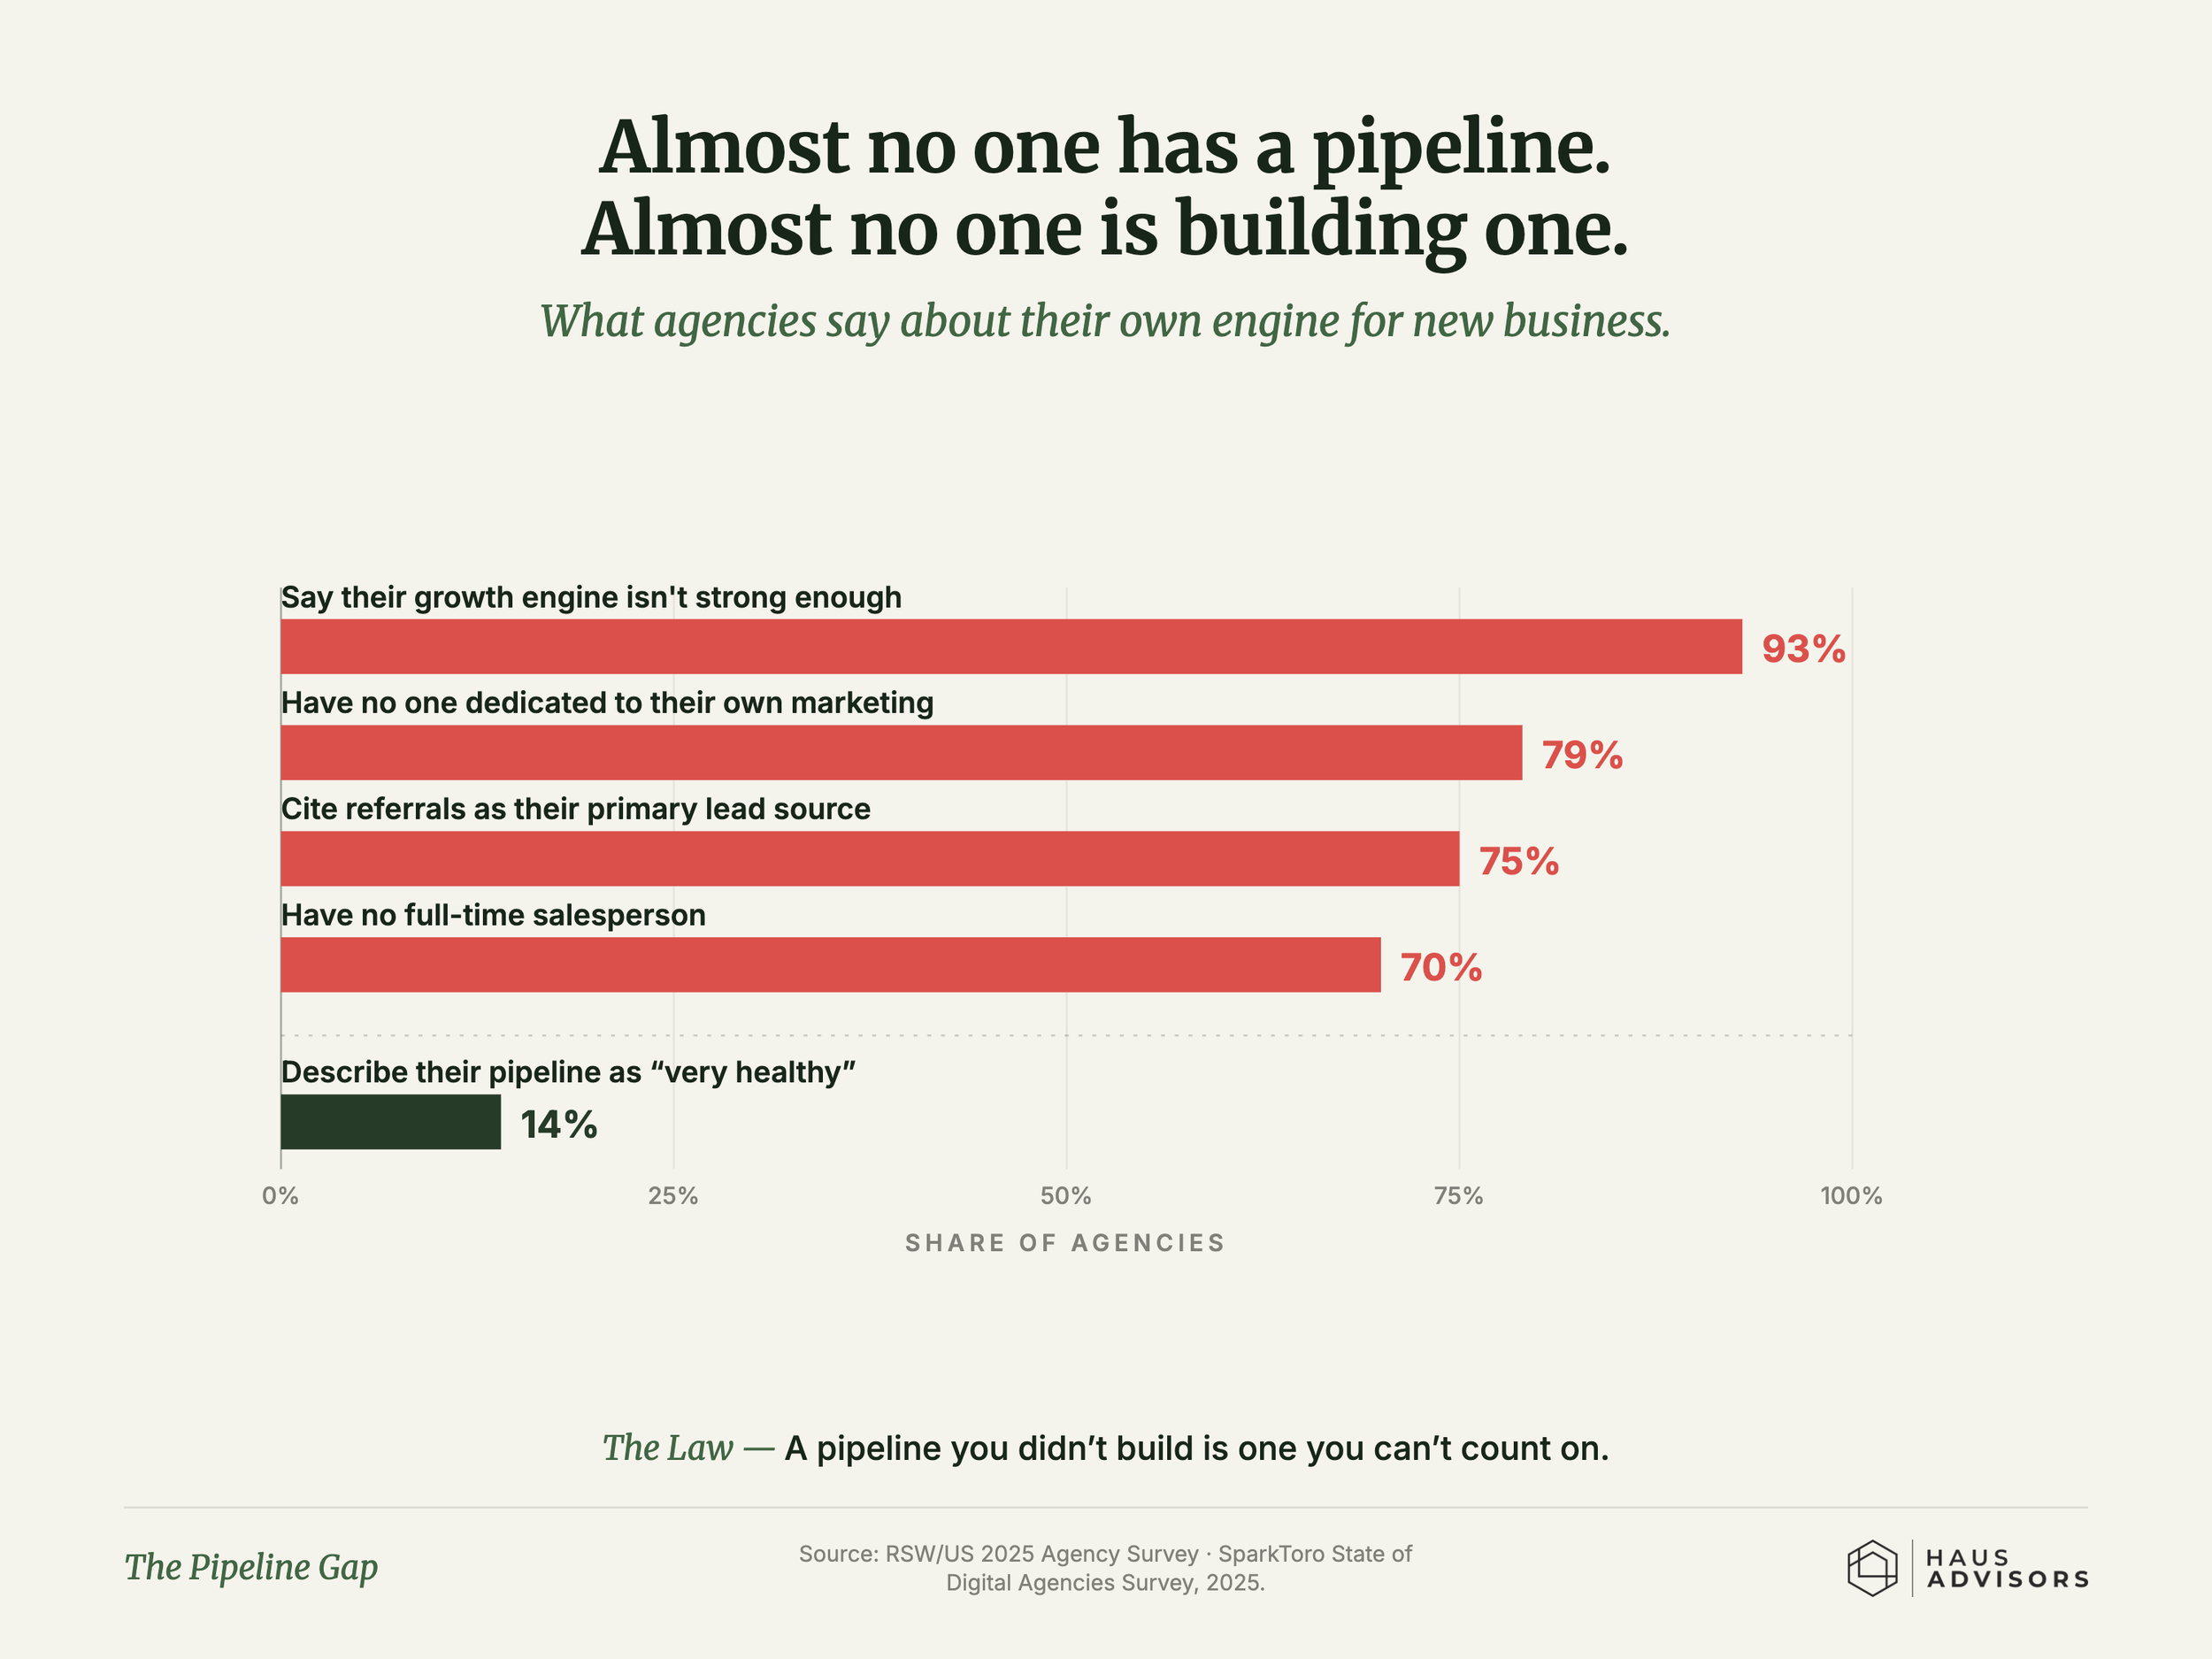
Sources: RSW/US 2025 Agency Survey (September 2025); SparkToro State of Digital Agencies Survey, 2025
A non-incumbent agency spends an average of $204,461 to pitch for a new client, covering staff time, external consultants, travel, research, and free-of-charge ideas. (Source: ANA, 4A's, and Advertiser Perceptions, "Cost of the Pitch," 2023)
Two in three clients retained the incumbent agency after their most recent agency review, meaning challenger agencies collectively share only about one-third of pitch wins. (Source: ANA, 4A's, and Advertiser Perceptions, 2023)
It takes 7 to 33 months to recover pitch costs after winning the business, depending on agency size. (Source: IAPI Ireland, "The OUCH! Factor™ Report," 2022)
85% of Agency New Business Directors last less than two years at the firms that hire them. (Source: RSW/US Agency New Business Report, 2023)
59% of agencies have tried outbound sales as a new business strategy; only 9% describe the results as "very effective," and 33% say it was not effective at all. (Source: SparkToro State of Digital Agencies Survey, 2025)
39% of agencies convert 25–49% of qualified leads to paying clients, with 55% reporting a typical sales cycle of 1–6 weeks from first contact to close. (Source: SparkToro State of Digital Agencies Survey, 2025)
73% of agencies say LinkedIn is the most effective social channel for driving new business, though 20% say social media plays no role in their marketing at all. (Source: SparkToro State of Digital Agencies Survey, 2025)
Drew McLellan of the Agency Management Institute estimates that 65–70% of net new agency revenue should come from existing clients. (Source: RSW/US Agency New Business Report, 2023, citing AMI research)
Smallest agencies (1–19 staff) win 51% of pitches they enter. Mid-sized agencies (50–99 staff) win only 32% — the lowest rate of any size band. Larger agencies (100–199 staff) win 55%. (Source: IAPI Ireland, "The OUCH! Factor™ Report," 2022)
Pitching takes an average of 44 hours per pitch for senior account director-level roles, and more than one-third of agencies adjusted their staffing as a direct consequence of pitch workload. (Source: European Association of Communications Agencies (EACA), "Cost of Pitching Report," 2025)
Takeaway: The $204K pitch cost and the 7–33 month payback period are the numbers most agency owners haven't seen before, and they reframe the whole new business conversation. Every unpaid pitch isn't just a cost, it's a loan you're making to a prospective client with no guaranteed return. The agencies that win consistently aren't pitching more. They're creating conditions where clients come to them already decided.
The Specialization Premium
The clearest finding across multiple years of agency benchmark data is that more focused agencies outperform generalists on both margins and growth — often by a wide margin.
“Agencies that reduced their service offerings averaged 30% net margins in 2025 and 13% revenue growth — while the industry average was 13% net margins and 7.5% revenue growth.”
Agencies that narrowed services grew at 13% on average in 2025 and posted 30% net margins — more than double the 13% industry average for margins. (Source: Promethean Research, 2026 State of Digital Services)
Design agencies grew 3× faster than blended generalist agencies in 2025. (Source: Promethean Research, 2026 State of Digital Services)
Specialist agencies should target $250,000+ in revenue per employee, compared to a $180,000+ target for generalists. (Source: Sakas & Company, agency consultant)
Service mix was one of the clearest profitability signals in Promethean Research's 2025 data. Agencies that expanded services grew faster than those that held steady — but they earned below-average net margins. Agencies that reduced services grew the fastest and earned the highest net margins. (Source: Promethean Research, How Profitable Are Digital Agencies?, 2026)
62% of marketing service firms are now packaging their offerings into productized services, with 86% planning to increase this approach in the next 12 months. (Source: RSW/US 2025 Agency Survey)
Takeaway: The specialization data isn't a suggestion, it's the clearest signal in five years of agency benchmark research. Every metric points the same direction: focused agencies earn more, grow faster, and retain clients longer. The obstacle isn't knowing this. It's that narrowing feels like leaving money on the table, when the data says the opposite is true.
AI Adoption in Marketing Agencies
AI adoption accelerated significantly between 2023 and 2025. The question is no longer whether agencies are using AI — it's whether they're capturing the margin benefit or giving the efficiency back to clients through lower rates.
“34% of agencies had already implemented AI across their entire business by early 2026, and another 28% were actively in the process of doing so — meaning 62% are in some stage of meaningful AI implementation.”
34% of agencies had fully implemented AI across the business by February 2026, up significantly from 2023 levels when most agencies were still in the exploratory phase. (Source: Promethean Research, 2026 State of Digital Services)
28% of agencies were actively implementing AI across functions at the time of Promethean Research's February 2026 survey, covering coding, design, copywriting, marketing, operations, project management, sales, and video. (Source: Promethean Research, 2026 State of Digital Services)
77% of marketing services firms are already using AI specifically for business development, with 80% planning to expand that use. (Source: RSW/US 2025 Agency Survey)
AI is creating margin risk for agencies that price by the hour. If AI reduces production hours and the agency keeps time-based pricing, clients will demand lower rates. Agencies selling expertise rather than effort are better positioned to capture AI efficiency as profit rather than giving it away as discounts. (Source: Promethean Research, How Profitable Are Digital Agencies?, 2026)
Only 28% of agencies raised prices from 2024 to 2025 — down from higher levels during 2021–2022 — suggesting the AI-driven pricing pressure is already visible in rate data. (Source: Promethean Research, Digital Agency Industry Report, 2026)
Takeaway: The risk isn't falling behind on AI adoption, 62% of agencies are already implementing it. The risk is capturing the efficiency as lower prices instead of higher margins. If AI cuts your production time in half and you pass that savings to clients through reduced rates, you've worked harder to earn the same revenue. The agencies that will benefit most are the ones selling outcomes, not hours.
Frequently Asked Questions
-
The average digital agency earned a 13% after-tax net margin in 2025, according to Promethean Research's 2026 State of Digital Services survey of 119 agency leaders. The long-run industry average since 2015 is approximately 15%. Size matters significantly: studio agencies with fewer than 10 employees averaged 19%, while agencies with 50 or more employees averaged only 8%. The best-performing agencies — those that narrowed their service offerings — averaged 30% net margins.
-
There are over 71,000 digital agencies in North America as of 2026, according to Promethean Research. The global count exceeds 200,000. The North American agency count has grown at approximately 12% CAGR since 2018. Despite this growth, 87% of North American agencies employ fewer than 50 people — the industry is overwhelmingly composed of small and micro firms.
-
Referrals are the primary new business source for 75% of marketing agencies, according to RSW/US's 2025 Agency Survey. However, RSW/US cautions that relying on referrals alone is unsustainable — 93% of marketing service firms say their growth engine isn't strong enough, and the data shows most agencies lack any dedicated sales or marketing function to supplement referral volume when it slows.
-
Marketing agencies averaged $163,000 in revenue per full-time employee in 2025, based on Promethean Research data. The Agency Management Institute's 55:25:20 benchmark implies a healthy revenue-per-employee range of $135,000–$257,000. Agency consultant Karl Sakas sets $180,000+ as the target for generalist agencies and $250,000+ for specialists. Agencies below $120,000 per employee face significant structural risk, particularly if revenue softens.
-
A non-incumbent agency spends an average of $204,461 to pitch for a new client, according to a 2023 joint study by the ANA, 4A's, and Advertiser Perceptions. This covers staff time, external consultants, travel, research, and free-of-charge strategy work. Once the business is won, IAPI Ireland's 2022 OUCH! Factor™ report found it takes 7 to 33 months to fully recover those pitch costs through billing, depending on agency size.
-
Yes, significantly. Agencies that narrowed their service offerings averaged 30% net margins in 2025 versus the 13% industry average, according to Promethean Research. Focused agencies also grew faster: design agencies (typically more specialized) grew 3× faster than blended generalist agencies in 2025. The same pattern holds for revenue per employee — specialists should target $250,000+ per employee compared to $180,000+ for generalists.
Sources
Every statistic above is drawn from one of the following primary sources. No secondary aggregator citations were used — each stat is traceable to the organization that originally published it.
Promethean Research — 2026 State of Digital Services (N=119 agency leaders, February 2026)
Promethean Research — Digital Agency Industry Report (2026)
Promethean Research — How Profitable Are Digital Agencies? (April 2026)
RSW/US — 2025 Agency Survey: Rolling Into 2026 (September 2025)
RSW/US — 2023 Agency New Business Report
SparkToro — State of Digital Agencies Survey (2025)
ANA, 4A's, and Advertiser Perceptions — Cost of the Pitch (2023)
IAPI Ireland — The OUCH! Factor™ Report: Agency Pitch Cost Report (2022)
European Association of Communications Agencies (EACA) — Cost of Pitching Report (2025)
Agency Management Institute (AMI) — The Most Important Metric for Agency Profitability
Sakas & Company — Per-Capita Billables: Track Your Agency's Performance
AdAge Agency Report (2025) — as analyzed by Iota Finance
About the author
David Hoos
Founder, Haus Advisors
David Hoos works with marketing agency founders who have built real businesses but haven't yet built the systems that let those businesses run without them. Haus Advisors advises independent agencies on positioning, pricing, and pipeline — the three levers that determine whether an agency is a job or an asset.