Agency Utilization Rate: 2026 Benchmarks by Role (and Why the Averages Mislead)
Agency utilization rate is the share of your team's available hours that goes to billable client work. Agencies average about 65% firm-wide, and a healthy target depends on the role: 75 to 85% for production staff, 30 to 50% for founders and directors. (Source: The Wow Company, BenchPress 2023, £1m+ UK agencies; role ranges in the sections below)
Utilization rate = billable hours worked ÷ available hours.
Director-level staff average just 33% billable utilization, against 65% for the agency as a whole. (Source: The Wow Company, BenchPress 2023) And when The Wow Company surveyed 614 agencies, the directors of the most profitable and fastest-growing ones ran below that average. So if you're an agency owner pushing your own billable hours higher to save your margins, you're pulling the wrong lever.
That finding tends to land hard with founders who are billing 60, 70, sometimes 80% of their own time. They've been treating high personal utilization as a sign of discipline. In most cases it's a sign of a structural problem.
This guide breaks down what healthy utilization actually looks like by role and agency size, explains why the benchmarks you find online contradict each other, and introduces the one related metric (realization rate) that utilization alone can't protect.
Why the Benchmarks Contradict Each Other
Search "agency utilization rate benchmark" and you'll get numbers ranging from 55% to 90%, often in the same paragraph. Harvest says most agencies run at 55-60%. Teamwork says the ideal is 70%. Runn says 80-85% is optimal. Productive.io says industry standard is 85-90%.
They're all citing real data. The confusion comes from three sources.
Industry mix. Most utilization research covers all professional services (law firms, IT consultancies, engineering practices, marketing agencies) in a single pool. Pulling that average and applying it to an independent agency is methodologically sloppy, but it's what most content does. SPI Research's annual benchmark falls into this category (more on its 2026 numbers below).
Scheduled vs. delivered. Some benchmarks measure hours planned for billable work. Others measure hours actually billed and collected. A 15-point gap between those two numbers is common at agencies with scope creep and write-off habits. If you're comparing scheduled utilization to a delivered utilization benchmark, you're not comparing the same thing.
Agency type. Retainer-heavy agencies have predictable capacity demand and can sustain higher utilization targets. Project-based agencies have natural gaps between engagements that pull the average down structurally. One benchmark doesn't fit both.
The most useful data for independent agency founders comes from The Wow Company's BenchPress report, which surveys agencies specifically, not all professional services. Its 2023 findings for £1m+ UK agencies: 65% average firm-wide, rising to 75% for junior staff and dropping to 33% for directors.
That's the frame worth using. Not the generic 70-80% you'll find most places.
Billable vs. Productive Utilization
Two numbers get called "utilization", and they answer different questions.
Billable utilization is the share of available hours billed to clients. It's the number every benchmark on this page reports. Productive utilization adds the non-billable work you planned on purpose, like business development, internal IP and training. It tells you whether time is being used deliberately, not whether anyone is paying for it.
And there's a third number underneath both: realization, the share of billable hours that actually get invoiced (more on it below).
| Metric | Formula | Healthy range | A miss usually means |
|---|---|---|---|
| Billable utilization | Billable hours ÷ available hours | By role, see the sections below | Pipeline gaps or pricing (low); capacity strain (high) |
| Productive utilization | (Billable + planned non-billable hours) ÷ available hours | No published benchmark; track the trend | Time leaking into unplanned admin |
| Realization | Hours invoiced ÷ billable hours worked | 85 to 95% (Bennett Financials) | Scope absorbed without change orders |
Agency Utilization Benchmarks by Role
One number firm-wide tells you almost nothing useful. Utilization varies dramatically by role, and conflating a designer's target with a director's target is where most agency benchmarking goes wrong.
Production Staff (Designers, Developers, Copywriters)
Target: 75-85%
These roles exist to produce billable work. High utilization is expected, sustainable when workload is steady, and the clearest signal that capacity is being used well. Nymble's practitioner data puts the optimal range at 75-85%; Scoro's agency operations research lands at 75-80% for producers.
Sustained utilization above 85% is a warning sign. It usually means scope is being absorbed without change orders, or projects are being underestimated chronically, or both. When production staff consistently run at 90%+, quality starts to erode before the financial symptoms appear.
Project Managers and Account Managers
Target: 60-75%
PM and AM roles require meaningful non-billable time: internal coordination, status reporting, client relationship work that doesn't bill. Building in 25-40% non-billable is realistic and healthy at this level, not a sign of inefficiency.
The common mistake is applying the same utilization target to PMs as to production staff. It either underserves clients (because PMs are too billable to manage well) or produces false utilization numbers (because non-billable coordination gets logged as billable to hit the target).
Senior Leads and Creative Directors
Target: 50-65%
Senior creative and technical leadership requires unstructured time (quality review, concept development, team mentorship) that doesn't always bill cleanly. Pushing creative directors or senior engineers to 80%+ pulls them into execution and out of leadership, which reduces the quality that justifies their billing rate in the first place.
Bennett Financials, a fractional CFO firm that publishes agency utilization benchmarks, puts this range at 50-65%. That matches what I see in practice.
Founders and Directors
Target: 30-50%
This is the number that surprises most agency owners. And it's the one most worth understanding.
The BenchPress finding isn't an anomaly. It's consistent with the financial logic of how healthy agencies work. Director time spent on business development, culture, financial management, and strategic planning doesn't bill, but it directly generates the work that keeps everyone else billable, and it builds the enterprise value that makes the business worth something at exit.
If your personal utilization as an owner is above 60%, you don't have an efficiency problem. You have a bottleneck problem. You're in delivery when you should be building the business that makes delivery happen. The short-term revenue from your billable hours is real, but it's coming at the cost of the BD, positioning, and operational work that would multiply everyone else's output.
I've talked to enough founders running $1.5-3M agencies where the owner is still billing 50-60% of their time to say this confidently: the utilization number isn't causing the stall. It's a symptom of it.
Firm-Wide Average
Healthy utilization varies by 52 percentage points depending on the role. One firm-wide target isn't wrong, it's measuring the wrong thing.
| Signal | What It Usually Means |
|---|---|
| Below 60% firm-wide | Pipeline gaps, underpricing, or capacity misalignment |
| 65–75% firm-wide | Healthy range for most independent agencies |
| Above 80% sustained | Capacity constraint and/or burnout risk |
| Owner above 60% | Bottleneck; founder is the constraint |
The revenue math on closing a utilization gap is real. Harvest's calculator shows that a 20-point utilization gap across five people at a $125 blended rate is $259,800 in annual revenue. Nymble's data puts a 10-point gap across a 20-person agency at $500,000 in potential revenue at the same rate.
Those numbers are why utilization matters. But they also show why chasing utilization without understanding the role-by-role picture produces bad decisions.
Director Utilization
33%
Average billable utilization for director-level staff at £1m+ agencies, against 65% firm-wide.
The Wow Company BenchPress 2023
Effective Billing Rate
60%
What 80% utilization actually yields when realization rate is 75%, the compounding effect most agencies miss.
80% utilization × 75% realization
Annual Revenue Gap
$259,800
Revenue left on the table from a 20-point utilization gap across 5 people at a $125 blended rate.
Harvest calculator data
Annual Revenue Gap
$500,000
Revenue impact of a 10-point utilization gap across a 20-person agency at a $125 blended rate.
Nymble practitioner data
Which Benchmark Source Should You Trust?
Because the benchmarks contradict each other, here's what each major source actually covers and why their numbers differ.
The benchmarks you find most often are measuring the wrong population. BenchPress and Nymble are the only two sources that land in the right quadrant for independent agency operators.
| Source | What It Covers | Benchmark | Key Caveat | Trust Level |
|---|---|---|---|---|
| Wow Company BenchPress | Independent agencies specifically | 65% avg; 75% junior; 33% directors (2023, £1m+ UK agencies) | Most agency-specific dataset available; UK sample | Best fit |
| Nymble practitioner data | Agency operations (delivered utilization) | 65–75% optimal | Delivered, not scheduled , closest to real-world | Best fit |
| Harvest | Independent service businesses | 55–60% current reality | Self-reported by Harvest users; skews smaller shops | Use with context |
| Runn | Agencies and consulting firms | 80–85% optimal | Scheduled utilization, not delivered, inflates the target | Use with context |
| SPI Research (2026 PS Maturity Benchmark) | 509 professional services firms, 2025 data | 66.4% (record low); 75% optimal | Pools IT, consulting and other PS firms; not agency-specific | Not agency-specific |
| Gartner | Enterprise project resources | Cap at 80% | Enterprise context; not SMB agencies | Not agency-specific |
Last updated October 2026.
The New-Business Engine
Is this your agency?
If your founder utilization is above 60%, the benchmark isn't the problem. Most founders who come to us with a utilization question are really running a business that only grows when they're in the room. If you want your agency to grow without needing you in every deal, that's what the New-Business Engine is built for.
Book a call to see if it's a fitProfessional Services Utilization Benchmarks (2026)
Agencies aren't the only firms selling hours, and the wider professional services data shows where the trend is going.
Professional services firms hit 66.4% billable utilization in 2025, the lowest level in the 19 years SPI Research has tracked it. (Source: SPI Research, 2026 Professional Services Maturity Benchmark, 509 firms, released February 24, 2026)
That's down from 68.9% in 2024, and below the 75% SPI considers optimal. (Source: SPI Research 2026, via Deltek)
But margins went the other way. Average project margin improved to 37.7% in the same year utilization hit its low. (Source: SPI Research 2026) So the firms weren't making more money by filling more hours, which is the same thing the role-by-role data above says about agencies.
| Metric (SPI Research, 2026 PS Maturity Benchmark) | Value |
|---|---|
| Firms surveyed | 509 (2025 data; 245,000+ employees) |
| Billable utilization, 2025 | 66.4%, lowest in SPI's 19-year history |
| Billable utilization, 2024 | 68.9% |
| SPI healthy minimum | 70% |
| SPI optimal | 75% |
| High-performing firms | 75.0% |
| Average project margin, 2025 | 37.7% |
One caveat, the same one from the top of this page: SPI pools IT consultancies, management consultancies and other professional services firms. Use it as context for direction, not as your agency's target.
Utilization by Agency Type and Size
The role-by-role framework above applies broadly, but your agency model changes what firm-wide utilization target makes sense.
Retainer-heavy agencies can set and maintain higher firm-wide targets, closer to 70-75%, because demand is predictable. You know roughly what's coming 90 days out, so capacity planning is a forward-looking exercise. The risk at this model is over-promising capacity. Utilization looks fine on paper while client satisfaction erodes because the team is spread too thin.
Project-based agencies have natural utilization gaps between engagements that structurally pull the average down. A realistic healthy target here is 60-68% firm-wide. Don't benchmark against retainer norms. Low utilization during a gap period isn't an efficiency failure, it's a pipeline and BD issue that shows up in utilization with a 60-90 day lag.
Under 10 people, utilization tracking is useful as a general health check but can be misleading as a management tool. One person's project gap swings the number significantly. Owner involvement in delivery inflates senior-role utilization and obscures the strategic cost. At this size, the more important question usually isn't "how's our utilization?", it's "is the owner building the business or delivering in it?"
10-30 people is where role-by-role utilization tracking earns its keep as an operational tool. At this scale, a sustained firm-wide average above 75% for two consecutive quarters is a signal that capacity is the constraint, and you should be making a hiring decision, not celebrating the efficiency.
Utilization vs. Realization: The Metric Most Agencies Skip
Utilization tells you how much of your team's available time is going toward billable work. It doesn't tell you how much of that work is actually getting billed and collected.
That's realization rate, and it's the metric that explains why a team can look entirely buried in work while the agency's bank account stays flat.
Utilization = billable hours worked ÷ available hoursRealization = hours actually billed and collected ÷ hours worked on billable projects
The two compound:
80% utilization × 75% realization = 60% effective billing rate
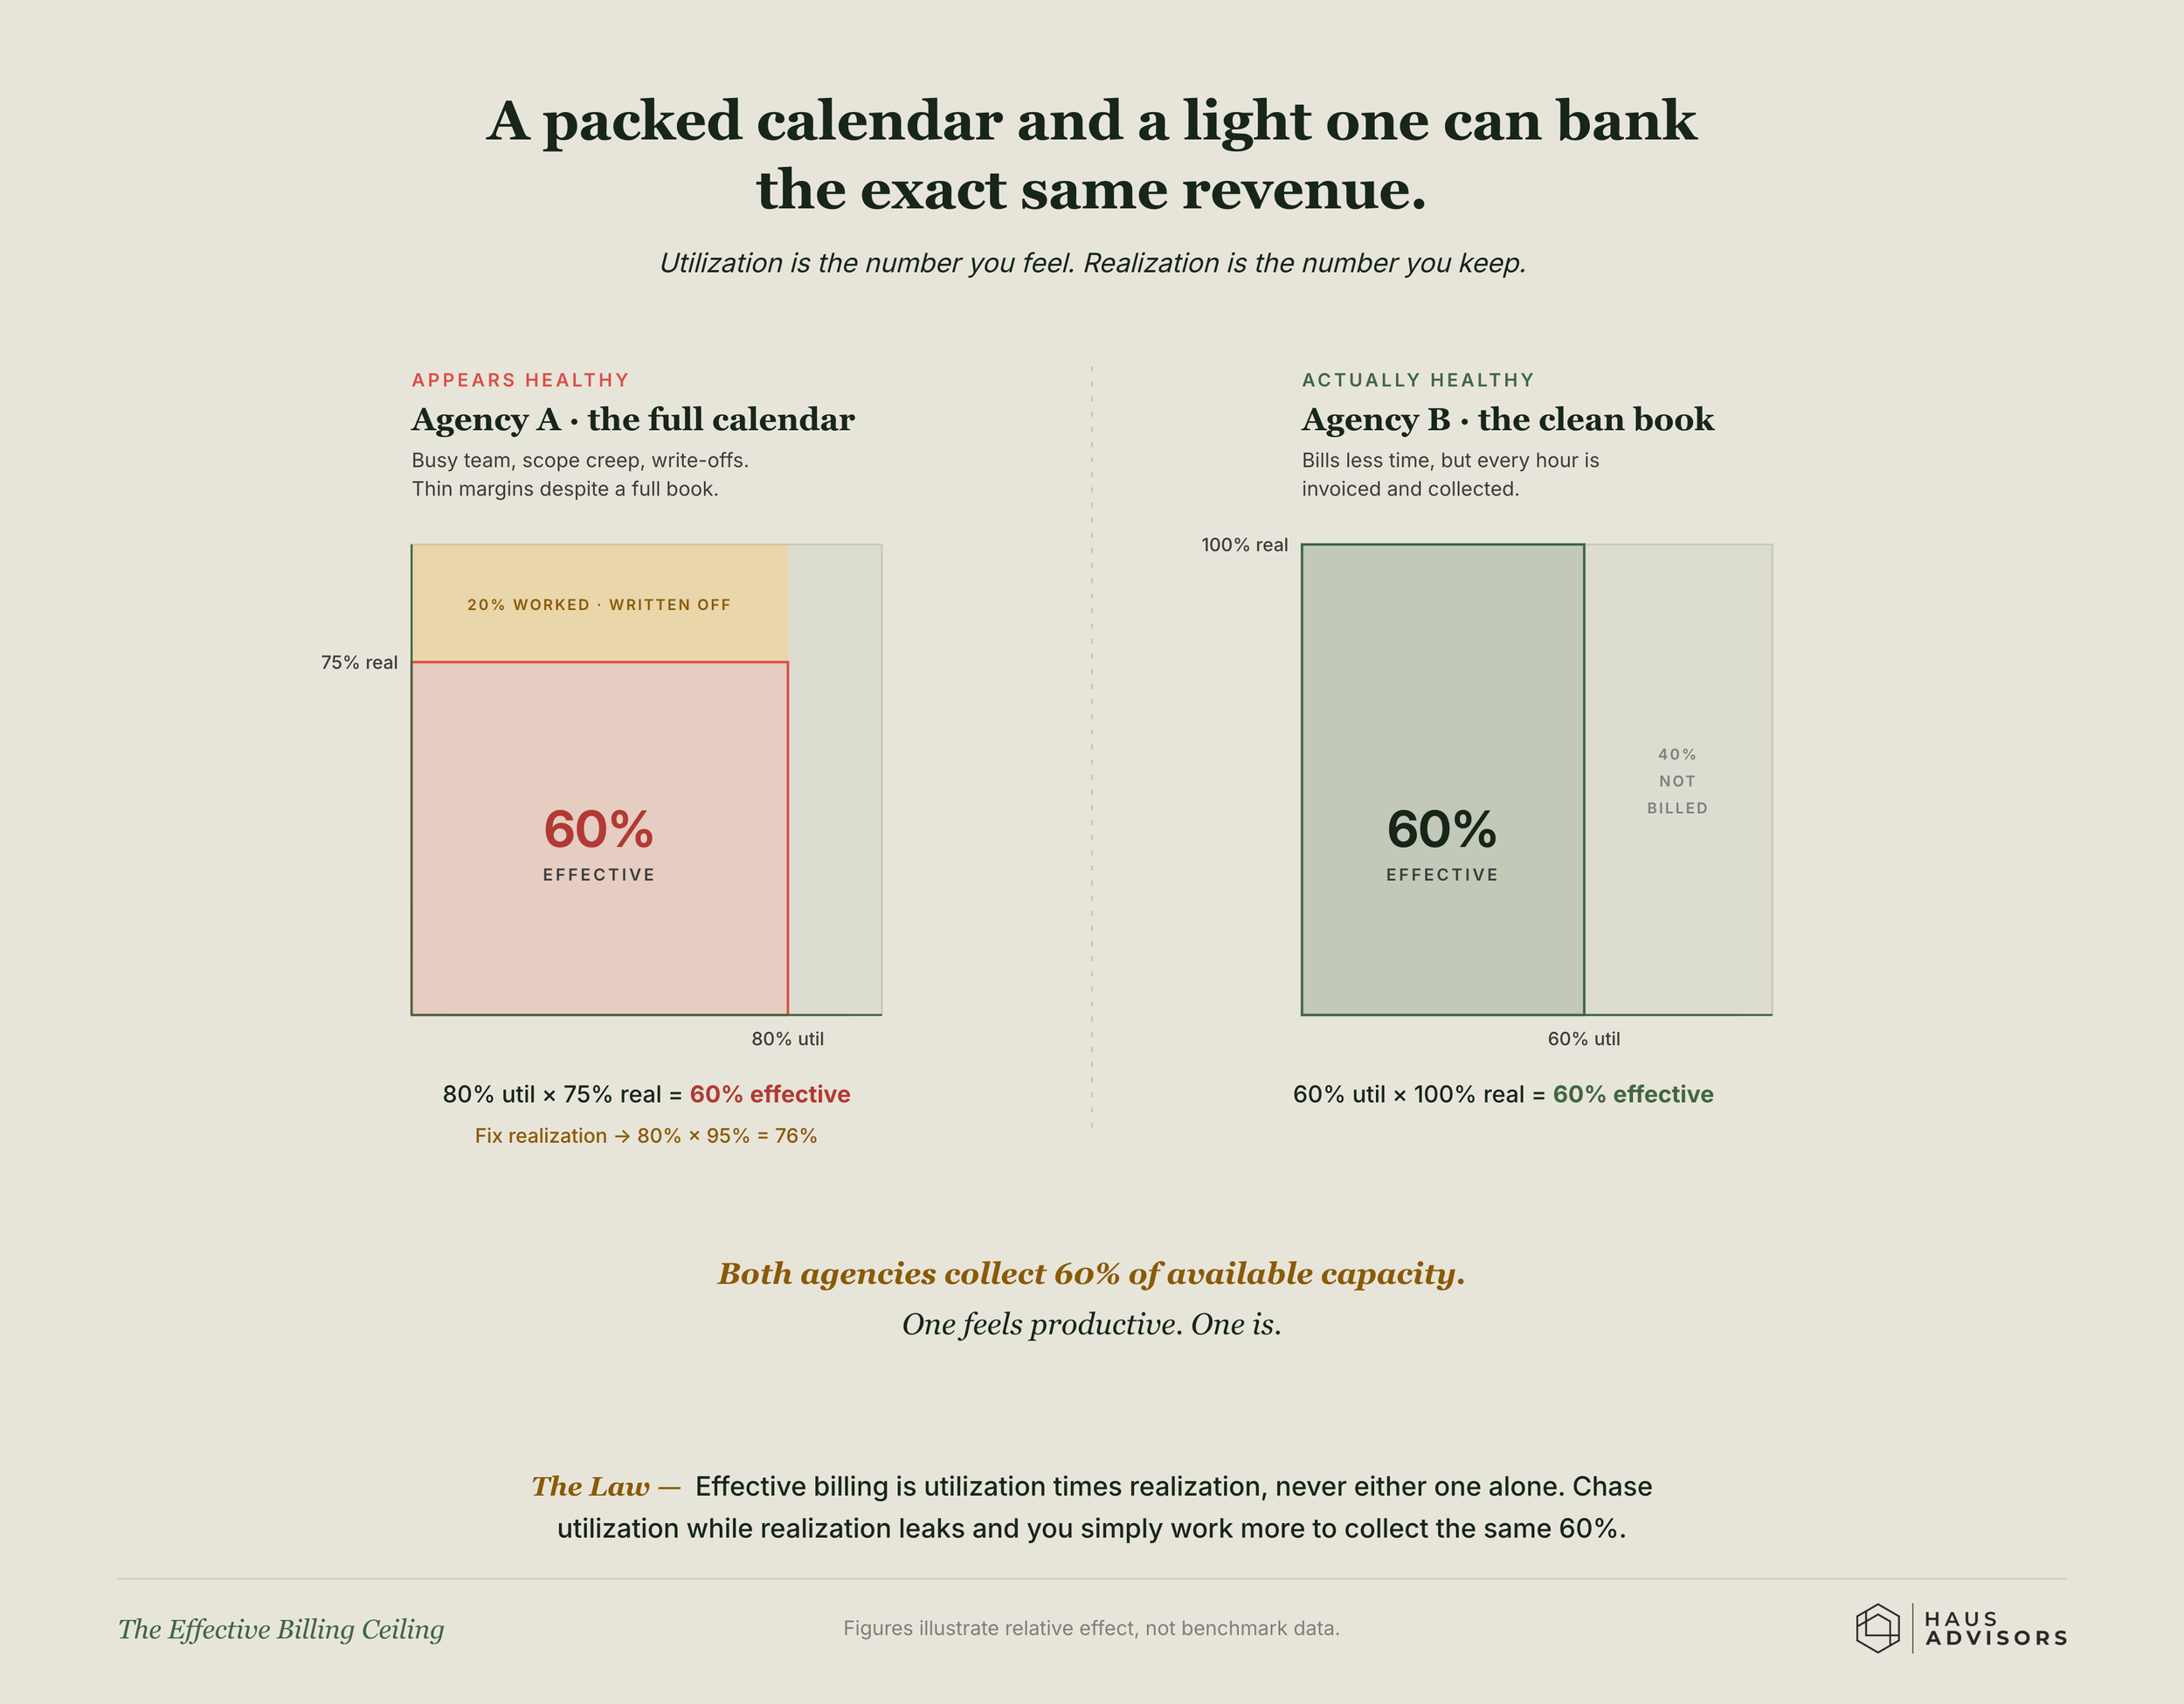
80% utilization with 75% realization produces the same financial result as 60% utilization with no write-offs. The team feels busy. The bank account says otherwise.
An agency at those numbers is collecting 60% of its available capacity, functionally equivalent to an agency running 60% utilization with no write-offs. The team doesn't feel that way. They feel busy. But the financial outcome is the same.
Bennett Financials benchmarks a healthy realization rate at 85-95%. Below 80% signals systemic problems: scope being absorbed without change orders, clients being discounted post-delivery, or fixed-fee bids being chronically underestimated.
Most agencies never calculate their realization rate because it requires comparing hours logged on a project to hours invoiced on that project. Project management tools show the first number. The invoice is in the accounting system. Pulling the two together takes deliberate effort. But it's the fastest way to find out whether a utilization gap is a capacity problem or a scope and pricing problem.
If your utilization looks fine but your margins are thin, check realization first.
What Low and High Utilization Are Actually Telling You
Utilization is a lagging indicator. By the time it shows up as a problem, the cause is usually 60-90 days in the past. Understanding what each utilization pattern points to is more useful than optimizing the number directly.
Firm-wide utilization below 60% almost always traces to one of three things: inconsistent pipeline (gaps in BD activity 60-90 days ago), underpriced services (can't fill capacity at profitable rates because the positioning isn't clear enough to command them), or capacity that outpaced demand when you hired for a projected growth rate that didn't materialize. The fix is upstream, not in utilization tracking.
Founder utilization above 60% is the bottleneck pattern. The revenue from those billable hours is real, but the cost is in the BD, positioning, and operational work that doesn't get done. Agencies where the founder is highly billable tend to grow to a plateau and stay there, not because demand dried up, but because the person who should be generating demand is in delivery. This is the most common structural constraint I see in agencies between $1M and $3M revenue.
Production utilization above 85% sustained is a capacity and pricing signal, not something to celebrate. It means either you need to hire, or you need to raise rates so the same capacity generates more revenue with less stress on the team. Usually both.
Low realization alongside healthy utilization is a scope and pricing problem. The team is busy, the hours are logged, and not enough of them are making it onto invoices. Change order discipline, estimate accuracy, and post-project billing audits are the fixes, not more time-tracking.
This is why Haus Advisors looks at utilization data as a diagnostic rather than a target. The number itself isn't the problem. What it points to is.
In the New-Business Engine, founder utilization above 60% is one of the first signals we look for. When the founder is buried in delivery, the agency can't use the part of them that's worth the most: the reputation, the relationships, and the judgment that bring in the next client. Not because the billable hours aren't valuable. Because what those hours are costing the business is worth more.
If firm-wide utilization is low, that's usually a positioning and pipeline conversation. So that's where the first phase of the Program starts: pulling the positioning and the judgment out of your head, so the pipeline stops depending on you. The benchmark problem is rarely what it looks like on the surface.
How to Actually Use Your Utilization Number
A three-step process worth running this quarter.
Step 1: Calculate delivered utilization, not scheduled. Pull actual billed hours from your invoicing system for the last 90 days. Divide by available hours (headcount × working hours, minus PTO and holidays). This is the number that matters, not what your project management tool shows as planned.
Step 2: Break it out by role tier. Production staff, PMs, senior leads, and founder/directors should have separate numbers. The firm-wide average hides the signals that are actually useful.
Step 3: Run the realization check. For the same 90-day period, compare hours logged on projects to hours invoiced. If your realization is below 85%, you have a scope and pricing problem sitting underneath the utilization number.
Then compare what you have against the role-specific benchmarks above. Not the generic 70-80% you'll find most places, but the role-appropriate targets.
If your production staff is in range but your firm-wide average is dragged down by senior and director roles that are too low, that's a workload distribution and BD problem. If your production staff is running above 85% and the firm-wide number looks healthy, that's a capacity warning.
And if you as the founder are above 60%, that's the number worth fixing first.
Sources
The Wow Company, BenchPress 2023: Profit and Growth for £1m+ agencies (UK). 65% firm-wide, 75% junior and 33% director-level utilization, plus a separate 2023 survey of 614 agencies on director utilization at the most profitable agencies. Figures as quoted in Synergist's agency utilisation guide.
SPI Research, 2026 Professional Services Maturity Benchmark (509 firms, 2025 data, released February 2026), with figures via Deltek's summary.
Harvest, agency utilization benchmark and calculator.
Runn, utilization guidance for agencies and consultancies.
Productive.io, utilization guidance.
Nymble, agency operations data.
Scoro, agency operations research.
Bennett Financials, utilization and realization benchmarks for marketing agencies.
Gartner, enterprise resource utilization guidance.
Quick Diagnostic
What Is Your Utilization Pattern Telling You?
1. What is your firm-wide delivered utilization over the last 90 days?
2. What is your personal billable utilization as the founder or owner?
3. How does your production staff utilization compare to firm-wide average?
4. When you compare hours logged on projects to hours invoiced, what do you find?
Keep reading
Browse by topic
- Positioning & Strategy
- Lead Gen & Marketing
- Sales & Biz Dev
- Pricing & Productization
- Research & Data
- Operations & Delivery
- Client Retention & Expansion
- Leadership & Culture
For founders whose agency has outgrown referrals.
One idea a week that makes a hard growth problem obvious, usually with a chart that shows you the mechanism behind it.
Built from conversations with seventy-plus agency founders on the Behind the Agency podcast.